The Art of Data Storytelling
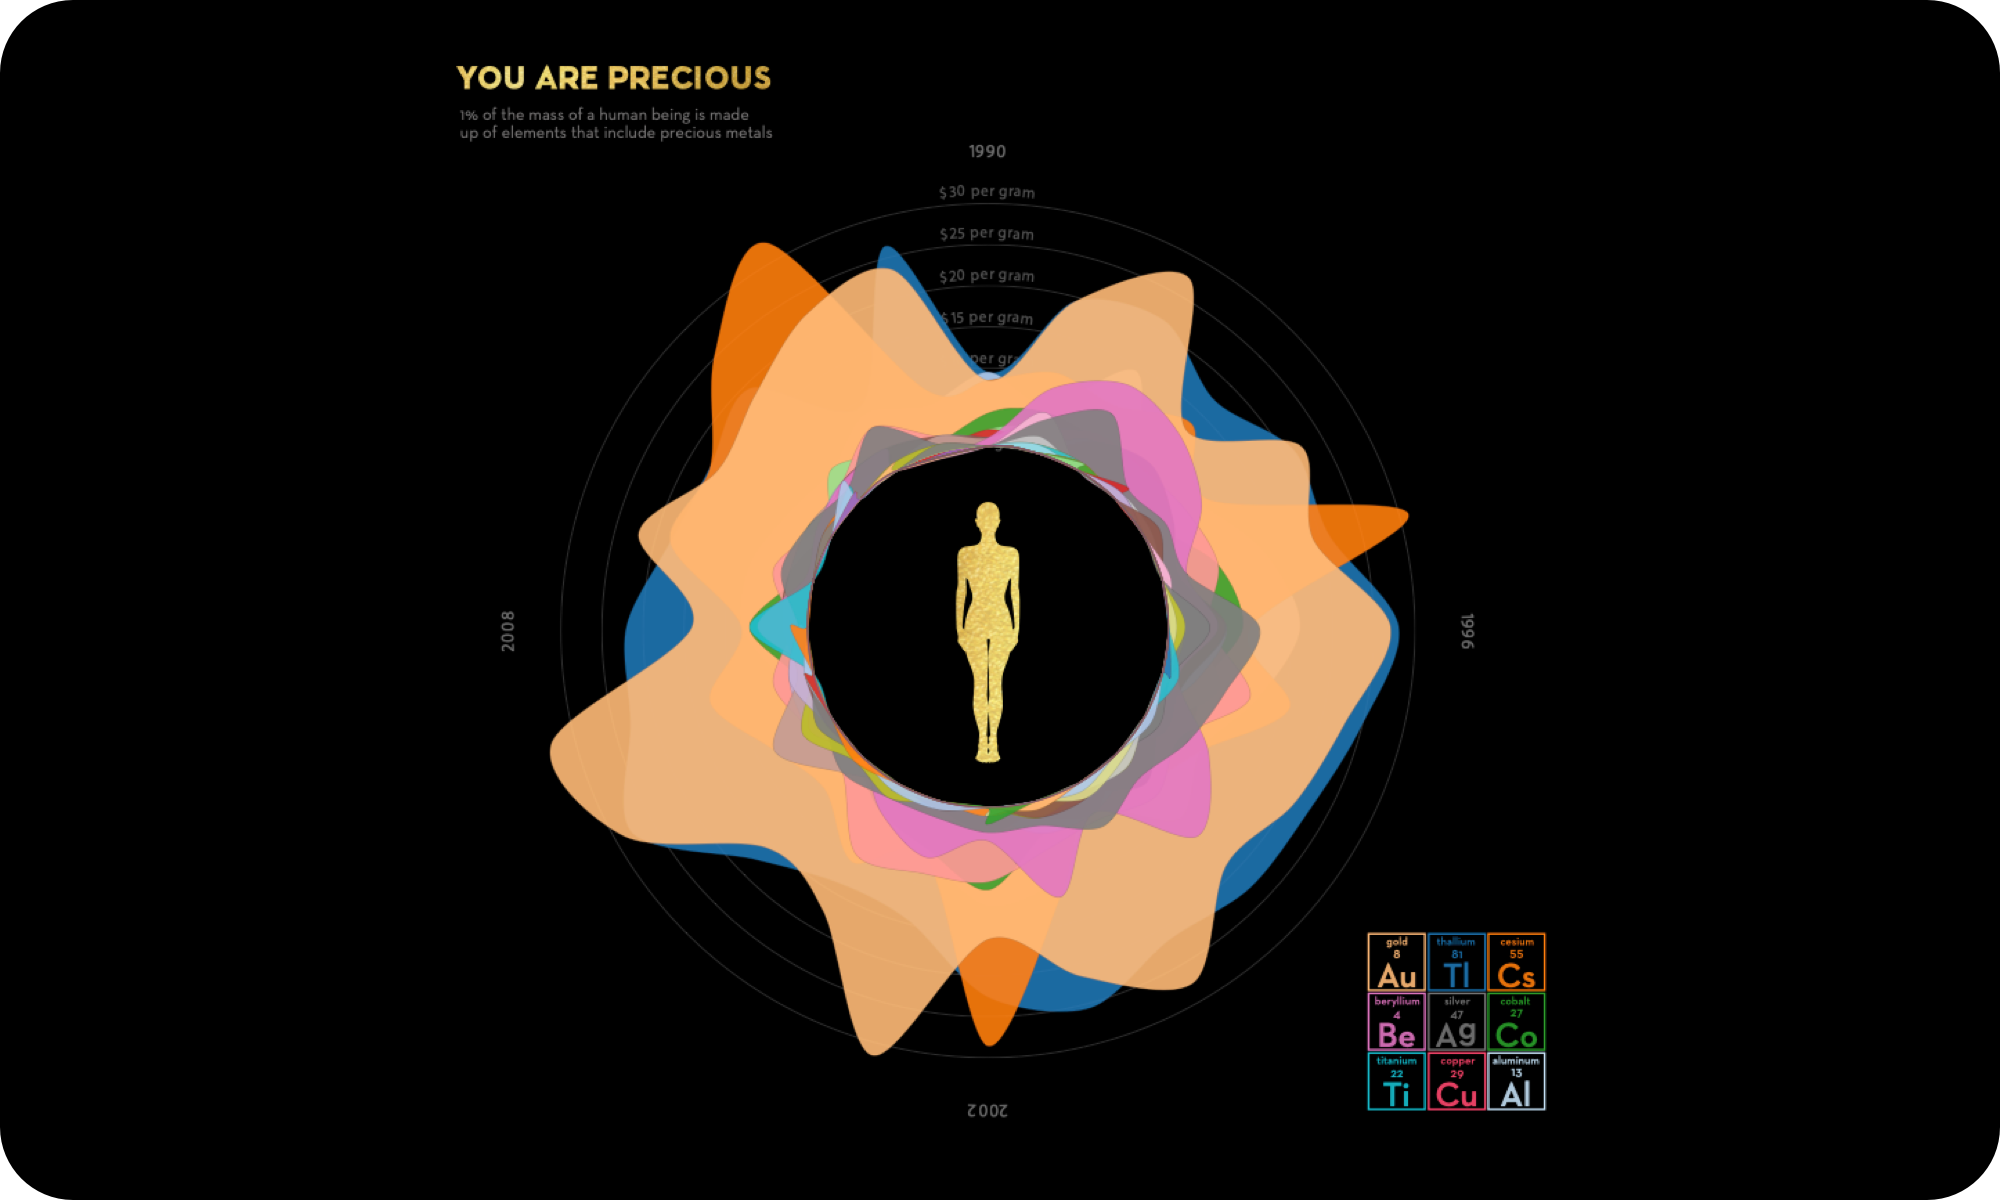
You Are Precious - is thought provoking data visualization that merges historical financial, bio-chemical and geological data to tell a story about human value. Through the use of a starburst chart just a few of the many precious materials present in the human body are hierarchically represented by the colorful concentric rings.
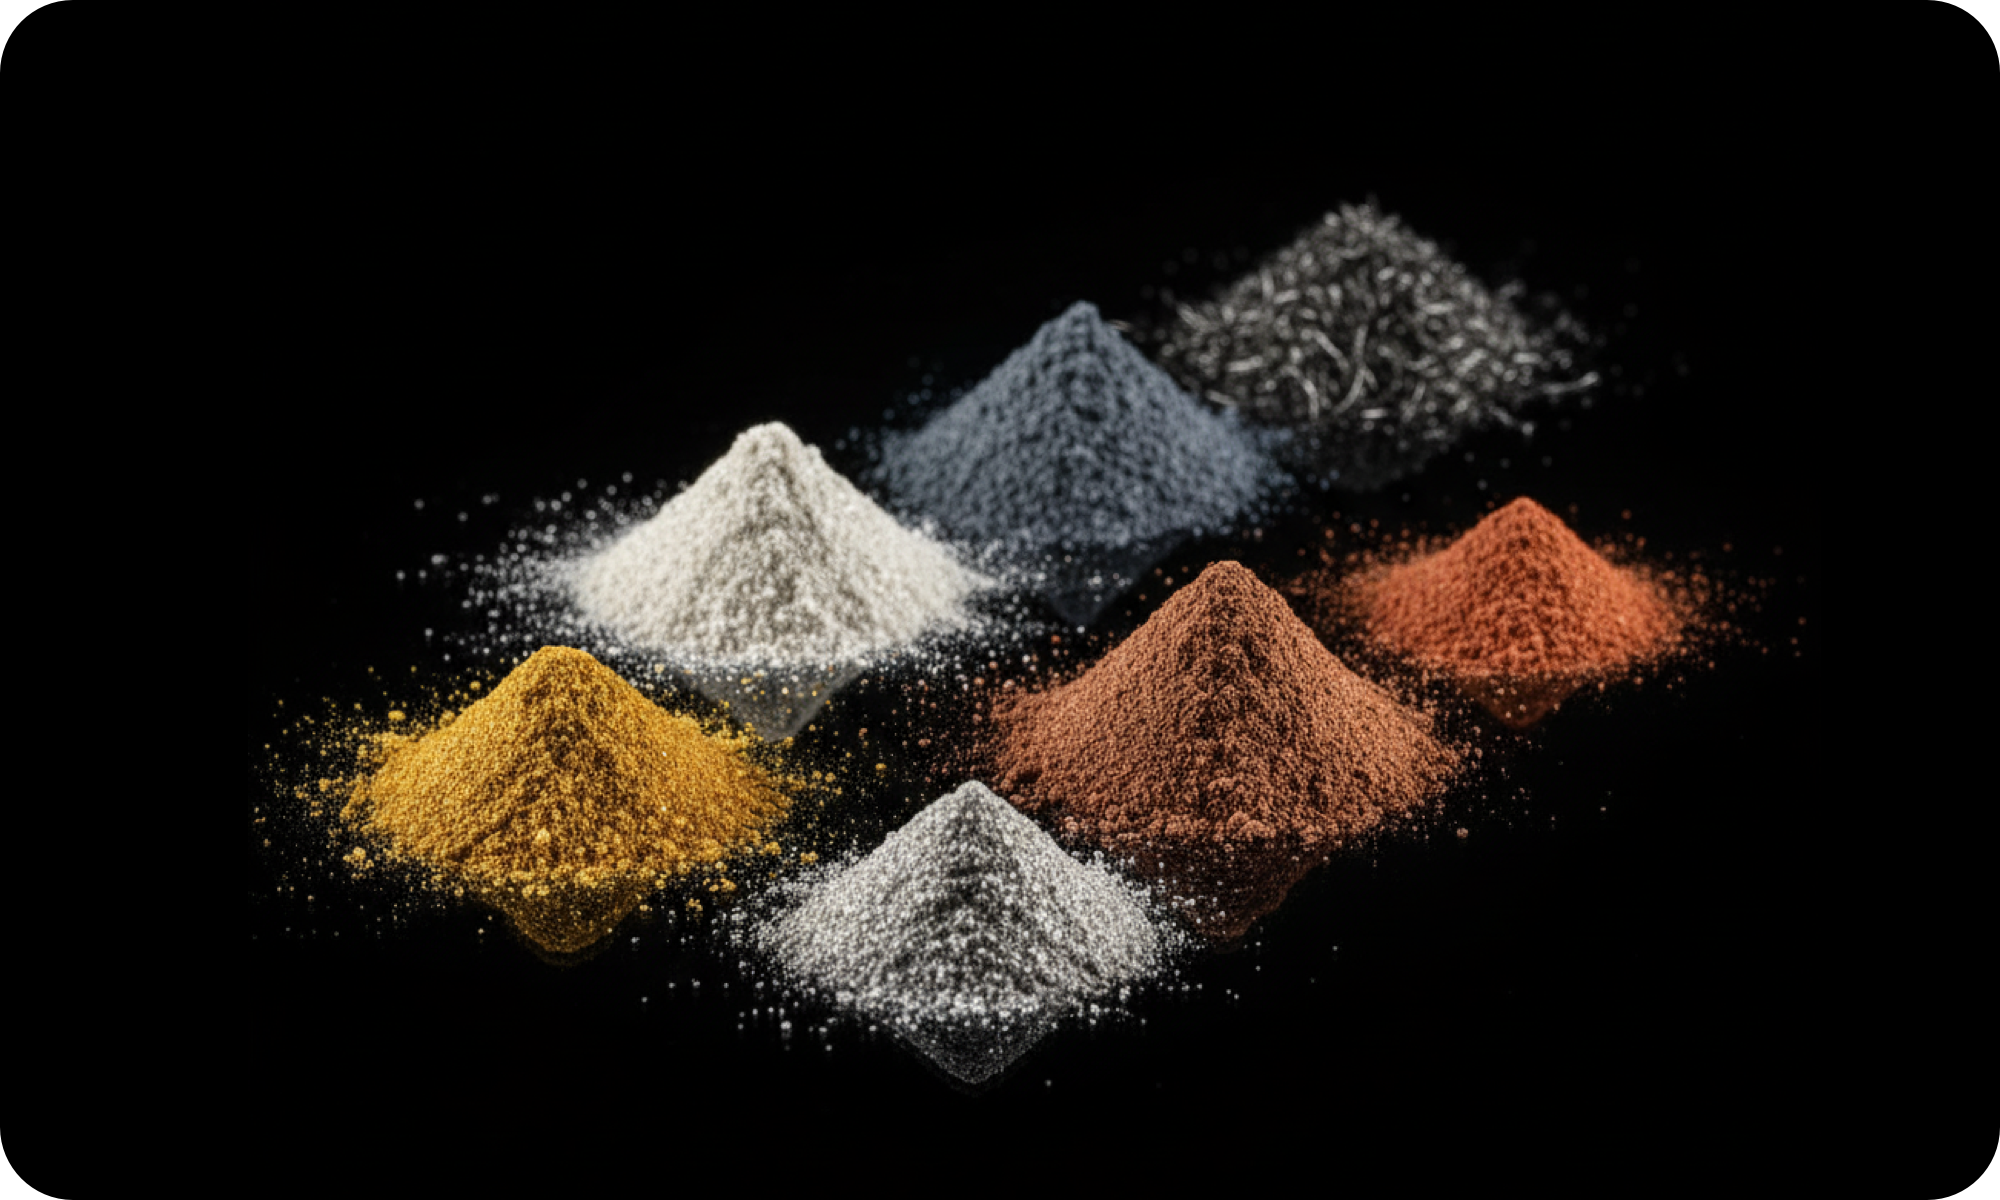
Gold, titanium, copper, silver and cesium are among some of elements and materials present, albeit in very tiny amounts. Using multiple datapoints (precious metal market values, biological percentages) to design a unique dataset that skewed more art than science. The dataset was then plugged into Adobe Illustrator to render the visualization.
This project explores the intersection of data visualization, human biology, and our perception of value through an interactive digital experience. By presenting complex scientific data in an accessible and engaging format, we challenge viewers to reconsider their understanding of what makes us precious as human beings.
You Are Precious was designed by Kaza Razat as part of a talk on data, art and technology presented at a leadership conference for the non-profit organization Black Girls Rock and hosted by Barnard College at Columbia University. The themes of the conference were the future of technology and data for young Black women.
Though the project was completed several years ago it is even more relevant today where themes of human self worth continue as labor, intelligence and biometric data are increasingly valued and devalued in the context of the AI revolution. The global arms race for rare earth metals as well as the impact on precious metal values due to geopolitical instability would likely show a profound impact on a visualization rendered today.